
💾 Where L&D Data Comes From — And What It Tells You
Data has become the backbone of modern Learning & Development (L&D) and Talent Development (TD) strategies. But for many professionals new to the field, the question isn’t just how to analyze data—it’s where the data even comes from in the first place.
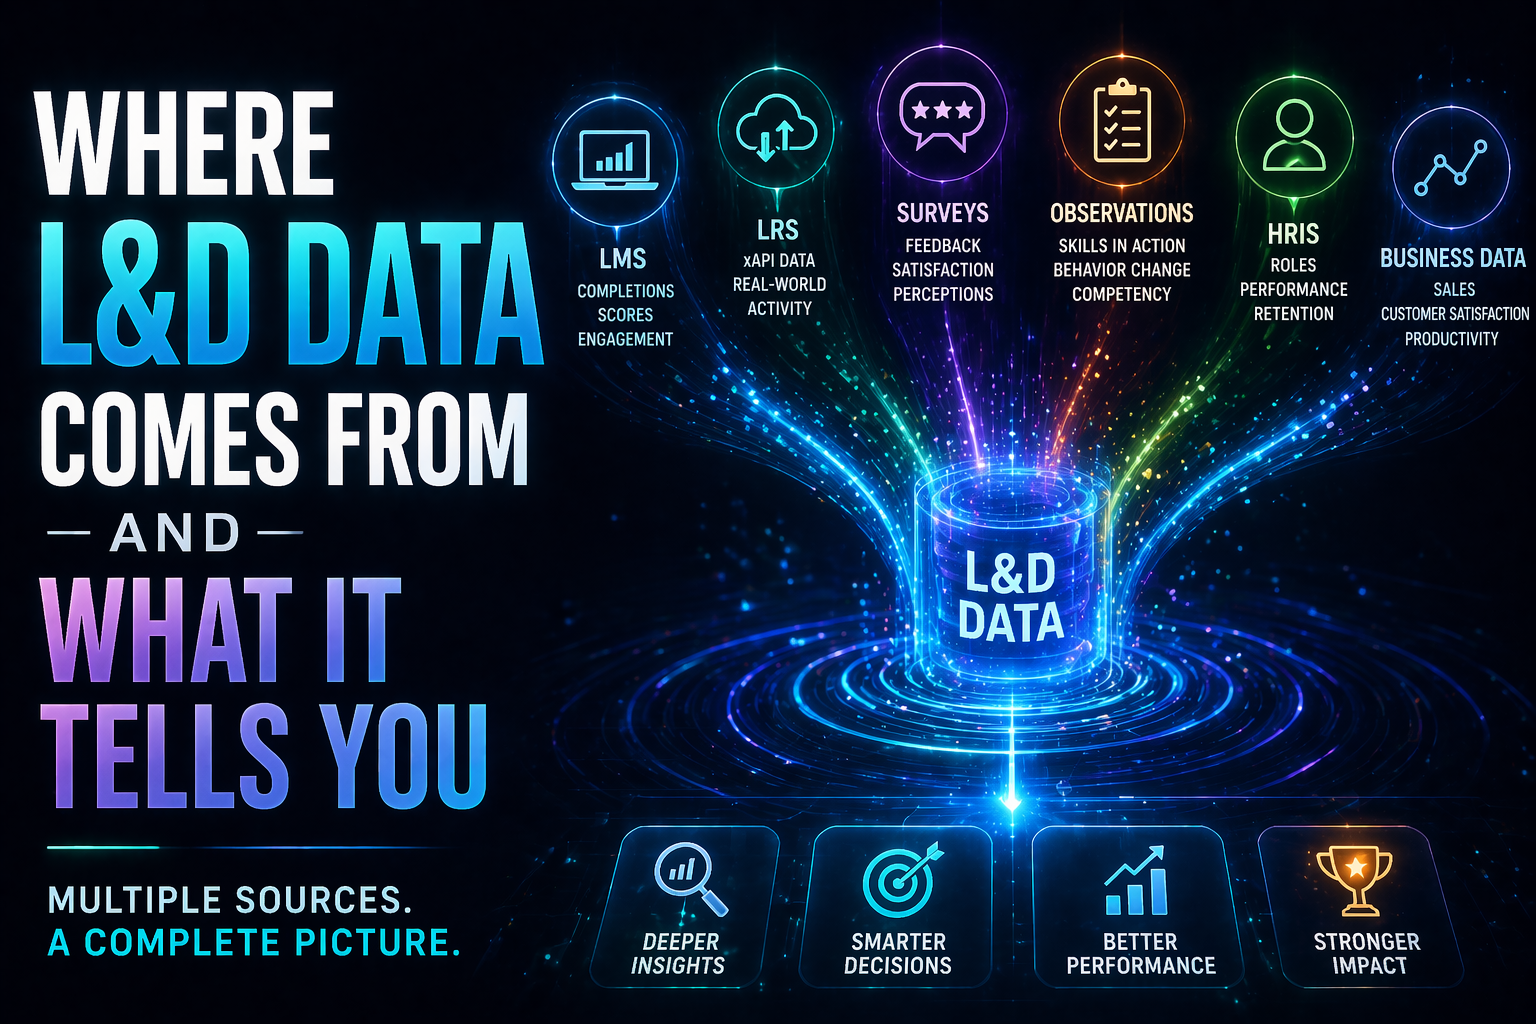
In this guide, we’ll break down the most common and useful sources of L&D data, explain what each one can tell you, and show how different types of data work together to paint a complete picture of learning impact.
The Starting Point: LMS Analytics
The Learning Management System is often the first stop in any data conversation. It houses much of the formal learning activity and can provide metrics such as:
Examples of data you can pull:
Completion rates – who finished the course and who didn’t.
Time spent – how long learners engage with each module.
Quiz scores – knowledge checks and assessment performance.
Engagement data – number of logins, clicks, or pages viewed.
What it tells you:
Whether learners are accessing and completing training.
How quickly they progress through courses.
Knowledge retention at specific checkpoints.
For example, if you notice a steep drop-off halfway through a module, that’s a signal to investigate—maybe the content is unclear, the session is too long, or the technology is frustrating learners.
Learning Record Stores (LRS)
An LRS is a specialized system for collecting, storing, and retrieving learning activity data—especially data generated from xAPI (Experience API). Unlike LMSs, LRSs can capture learning activity from any platform or environment, not just courses.
Examples of data you can pull:
Learning activity outside the LMS (watching videos, attending webinars, completing simulations, reading articles).
Real-world activity records (e.g., “Completed safety checklist in field”).
Performance tracking in immersive learning (VR/AR) or simulations.
An LRS can tell you:
What learning activities happen outside the LMS
How learners engage with resources in the flow of work
Whether skills are applied in real-world contexts
This matters because much of today’s development happens informally. An LRS is critical for blended learning environments, or when you want to capture continuous learning in the flow of work.
Hearing Directly from Learners: Surveys
Data from systems shows what happened; surveys help explain why.
Examples of data you can pull:
Quantitative: Ratings on course quality, relevance, ease of use.
Qualitative: Open-ended feedback on what was most useful or what should change.
What it tells you:
Learner satisfaction and perceived value of training.
Areas for content or delivery improvement.
Alignment with learners’ expectations and job needs.
For example, LMS data might show a 95% completion rate, but survey responses could reveal learners still feel unprepared. That’s the kind of context that prevents misleading conclusions.
Surveys are your go-to for voice-of-the-learner insights and quick post-training feedback.
Measuring Skills in Action: Observation Checklists
Some skills can’t be measured through a test alone—especially practical or behavioral ones. Observation checklists allow trainers, managers, or peers to watch a learner perform a task and record whether they meet specific criteria.
Examples of data you can pull:
Whether the learner follows correct procedures step-by-step.
Frequency of errors or missed steps.
Demonstration of soft skills (e.g., communication, teamwork).
What it tells you:
Skill transfer from training to the workplace.
Behavioral changes after training.
Competency against set standards.
When it’s useful:
Observation checklists are perfect for hands-on, practical training—like technical skills, safety procedures, or customer service.
Connecting Learning to People and Business: HRIS Integrations
An HR Information System (HRIS) is the database of records for employee information. Many LMS platforms can integrate with the HRIS to enrich learning data.
Examples of data you can pull:
Job role, department, and location.
Tenure and promotion history.
Performance review results.
When integrated with learning data, it can answer questions like:
Are specific job roles engaging more with training?
Does training participation correlate with promotions or retention?
Are performance scores improving after training?
HRIS data is key for personalizing training and linking learning to business metrics like turnover or performance improvement. This link between learning activity and HR outcomes is critical for demonstrating business value.
Uncovering Hidden Data Sources
Some of the most revealing data points aren’t in L&D systems at all. Consider:
Support tickets – A reduction after training can indicate improved skills.
Sales performance – Post-training increases suggest a measurable impact.
Customer satisfaction scores – Often a reflection of service quality improvements.
Productivity metrics – Can show efficiency gains after skill-building programs.
What it tells you:
Real-world results of training.
Problem areas that need new learning interventions.
Business-level ROI indicators.
These “hidden” sources connect training directly to organizational performance.
Combining Quantitative & Qualitative Data
No single data source tells the full story.
Quantitative data (numbers, scores, completion rates) gives you measurable evidence.
Qualitative data (comments, interviews, open-ended survey responses) gives you context and meaning behind those numbers.
Example:
Quantitative: Only 60% of learners passed the compliance quiz.
Qualitative: Comments reveal that unclear instructions and outdated scenarios caused confusion.
When combined, you can both diagnose the problem and take targeted action.
The Takeaway
No single data source will tell you everything you need to know. LMS reports might reveal completion rates, but not whether learning has stuck. Survey responses can highlight frustrations, but not always pinpoint the root cause. Observation checklists can confirm skills in action, but not whether those skills drive measurable business results.
The real power comes from combining these sources into a cohesive story—one that links learning activities to performance improvements and, ultimately, to organizational success.
Happy analyzing! 🔍📈