
💰 Understanding the Phillips ROI Methodology
Measuring the impact of training and development has always been a challenge. Talent Development (TD) professionals know that programs can influence everything from employee engagement to business results—but showing that value in a way that resonates with executives requires more than anecdotal success stories.
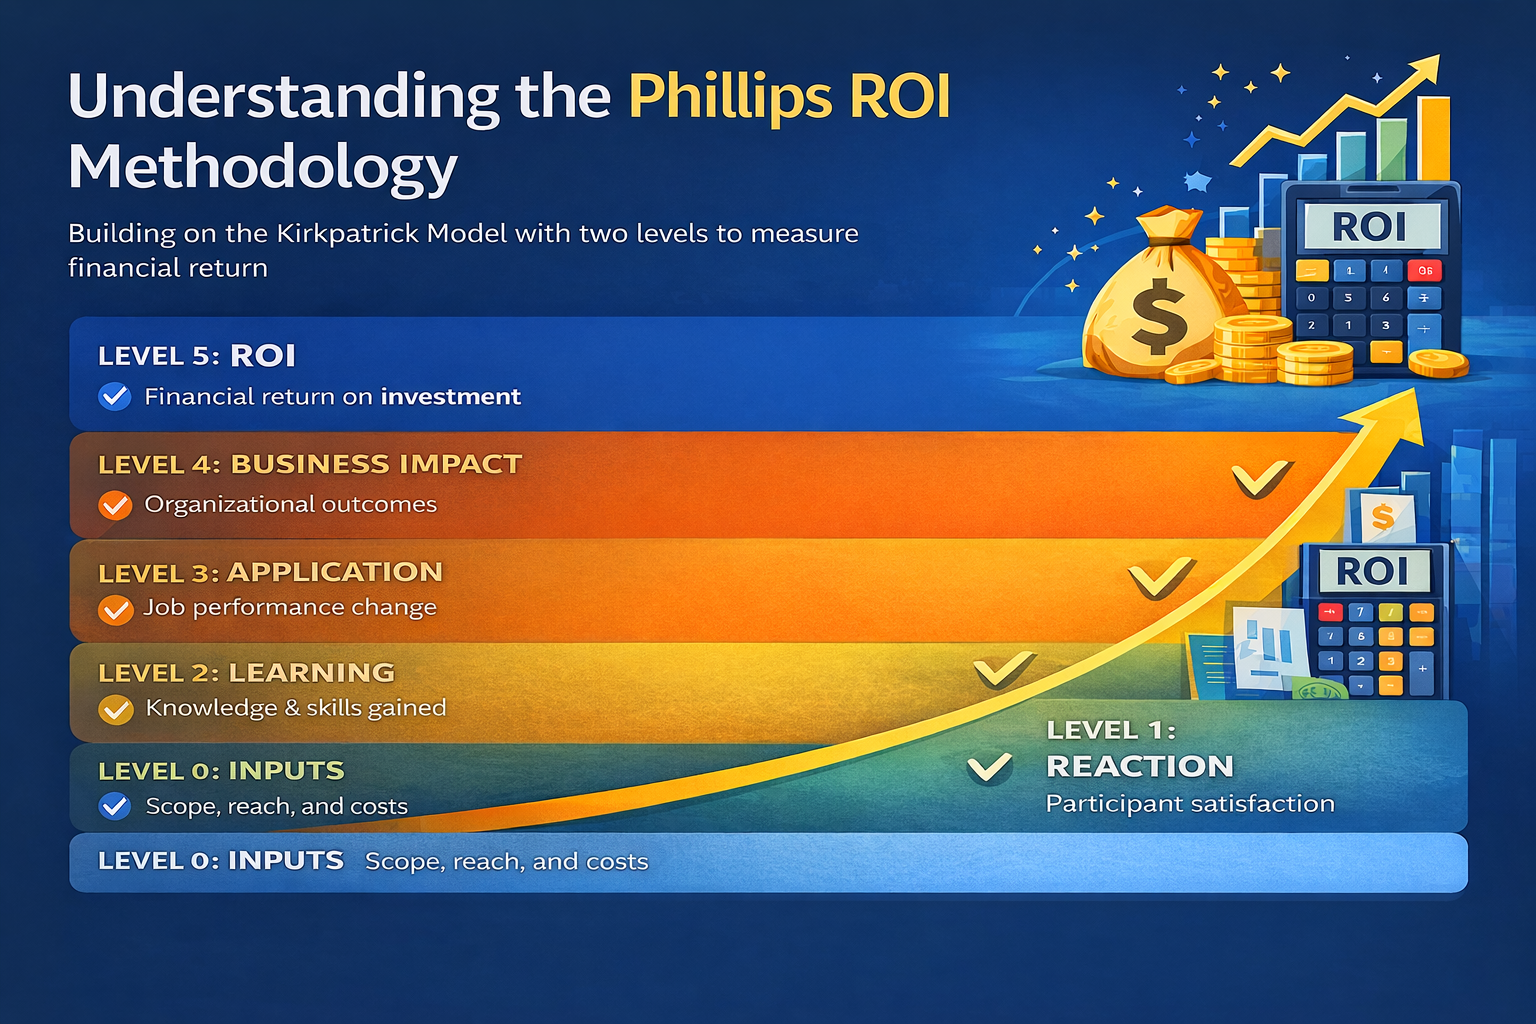
The Phillips ROI Methodology, developed by Dr. Jack Phillips, offers a structured approach for doing just that. By building on the widely used Kirkpatrick Model and adding two important levels—inputs and financial return—it gives TD leaders a clear, credible framework for proving value and making data-driven decisions.
The Evolution: From Kirkpatrick to Phillips
The Kirkpatrick Four Levels of Evaluation (Reaction, Learning, Behavior, and Results) provided the foundation for decades of training evaluation. While effective for understanding engagement, knowledge transfer, and application, it stopped short of converting results into financial terms.
Phillips extended the framework by adding:
Level 0: Inputs – The foundational data on program scope, reach, and cost.
Level 5: ROI – A calculation of net financial return, isolating the program’s impact from other factors.
These additions enable organizations to move beyond “Did they like it?” and “Did performance improve?” into “Was it worth the investment?”
When to Apply It
The Phillips ROI Methodology isn’t necessary for every training program—especially low-cost, low-impact initiatives. It’s best suited for:
High-profile strategic programs
Initiatives with significant investment
Projects where financial justification is expected
Pilots that could scale organization-wide
The Six Data Points in the Phillips Model
To apply the methodology, TD teams gather and analyze data across six connected points:
Level 0 - Inputs
Covers the quantitative basics of the program:
Number of participants
Delivery hours
Resources and materials used
Direct and indirect costs (development, delivery, participant time, travel, technology)
This baseline is essential for ROI calculations and understanding the scope of the investment.
Level 1 - Reaction
Measures participant satisfaction and perceived relevance. This often includes:
Post-program surveys
Participant comments
Likelihood of recommending the program
Positive reaction data helps validate the learning experience, though it does not indicate actual performance change.
Level 2 - Learning
Assesses the knowledge, skills, or attitudes gained through:
Pre- and post-tests
Skills demonstrations
Simulations or roleplays
Learning data confirms that the intended content was absorbed.
Level 3 - Application
Determines whether learning is being applied in the workplace:
Manager observations
Self-assessments
Workflow metrics (e.g., fewer errors, faster task completion)
This is where measurement moves from classroom impact to job performance.
Level 4 - Business Impact
Links application to organizational outcomes:
Sales revenue
Productivity measures
Quality improvements
Customer satisfaction
Employee retention
At this level, TD professionals work to isolate the effects of training—filtering out improvements caused by market conditions, technology upgrades, or unrelated initiatives.
Level 5 - ROI
Level 5 is all about answering one question:
“For every dollar we spent on this program, how many dollars did we get back in measurable business value?”
It’s not about fuzzy benefits or “people liked it.” It’s about cold, hard numbers that executives can compare to other investments the company makes.
Phillips uses the standard business ROI formula:
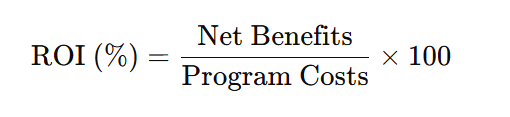
Where:
Net Benefits = Monetary value of training impact – Program costs
Program Costs = All expenses, including development, delivery, participant time, and materials
An ROI of 100% means the financial gains are equal to the costs; greater than 100% means the program delivered more value than it cost to run.
A Step-by-Step Example
If you’re anything like me and haven’t touched math since the early days of the new millennium, let’s walk through a simple example together.
Let’s say your company runs a Customer Service Skills Training for 50 front-line employees.
Step 1 – Identify Total Program Costs
You gather all direct and indirect costs:
Course development: $8,000
Trainer fees: $5,000
Participant time (paid hours spent in training): $7,500
Materials & technology: $2,000
Total Program Costs:
$8,000 + $5,000 + $7,500 + $2,000 = $22,500
Step 2 – Measure the Business Impact
After training, you measure outcomes tied to business goals. In this case:
Customer complaint resolution time drops by 25%.
Faster resolutions reduce the number of repeat calls, saving labor costs.
From operations data, you find:
Labor savings per month: $5,000
Over 12 months: $60,000 total savings.
Step 3 – Isolate the Training’s Contribution
Phillips stresses that you can’t assume all improvements are because of training—maybe a new software tool also helped.
So you work with managers to estimate that 80% of the improvement is due to the training.
Isolated Benefits:
$60,000 × 80% = $48,000
Step 4 – Calculate Net Benefits
Net Benefits = Isolated Benefits – Program Costs
$48,000 – $22,500 = $25,500
Step 5 – Calculate ROI
Net benefits: $25,500
Program Cost: $22,500

ROI = 113%
Step 6 – Interpret
113% ROI means that for every $1 spent, the organization gained $2.13 in value ($1 recovered + $1.13 net gain).
Executives see: “We invested $22,500 and gained $25,500 in net measurable value.”
You can still mention intangibles (e.g., morale, teamwork), but the ROI figure is the headline number.
Why ROI Matters for TD Professionals
Executive Alignment
C-suite leaders think in terms of investment and return. Providing ROI data frames TD initiatives as strategic business decisions rather than discretionary expenses.
Resource Justification
Clear ROI results can support budget requests, help prioritize programs, and protect funding during cost-cutting periods.
Program Improvement
The methodology’s structure highlights where results fall short—whether in participant engagement, knowledge transfer, or application—allowing for targeted improvements.
Best Practices for Using the Phillips ROI Methodology
Plan for ROI from the Start
Build measurement strategy into program design. Define what success looks like and how you’ll measure it.
Collaborate Across Departments
Partner with HR, Finance, and Operations to gather accurate data on costs, performance metrics, and business outcomes.Isolate Impact Carefully
Use control groups, pre/post comparisons, or expert estimates to distinguish training effects from other influences.Convert Only What’s Credible
Translate measurable outcomes into monetary terms using accepted business metrics, and avoid overestimating.Communicate for Your Audience
Executives want concise, profit-focused summaries; TD teams may need more detail for continuous improvement.
Final Thought
In an era where organizational priorities shift quickly and budgets are scrutinized, the ability to demonstrate the financial value of learning is no longer optional for Talent Development leaders.
The Phillips ROI Methodology offers more than a calculation—it’s a disciplined way to align training with business outcomes, isolate its real contribution, and communicate value in terms that drive decisions.
By mastering this approach, TD professionals strengthen their seat at the table and ensure their programs are seen as essential investments, not optional extras.
Happy evaluating! 💰📈