

OVERVIEW
This interactive training was designed to help clients at large organizations present data more clearly and confidently to their teams and stakeholders.
Data Presentation Training

This interactive eLearning experience trains clients that work at large companies to communicate data more effectively to their teams and stakeholders.
Audience: Clients who work at large companies
Responsibilities: Designed and developed the course, created all visuals, and led the live training sessions.
Tools Used: Articulate Storyline 360, Canva, and Audacity
Data Presentation Training
This interactive eLearning experience trains clients that work at large companies to communicate data more effectively to their teams and stakeholders.
Audience: Clients who work at large companies
Responsibilities: Designed and developed the course, created all visuals, and led the live training sessions.
Tools Used: Articulate Storyline 360, Canva, and Audacity
The client had asked for updates to existing training materials and support with facilitating workshops. But before jumping into design, I reviewed the content and conducted a learner needs analysis. That revealed the real issue: learners weren’t just disengaged—they were struggling to communicate what different graphs were showing.
The existing approach relied heavily on in-person explanations that often skipped foundational skills. Learners lacked confidence and were unsure how to describe or use data in everyday work.
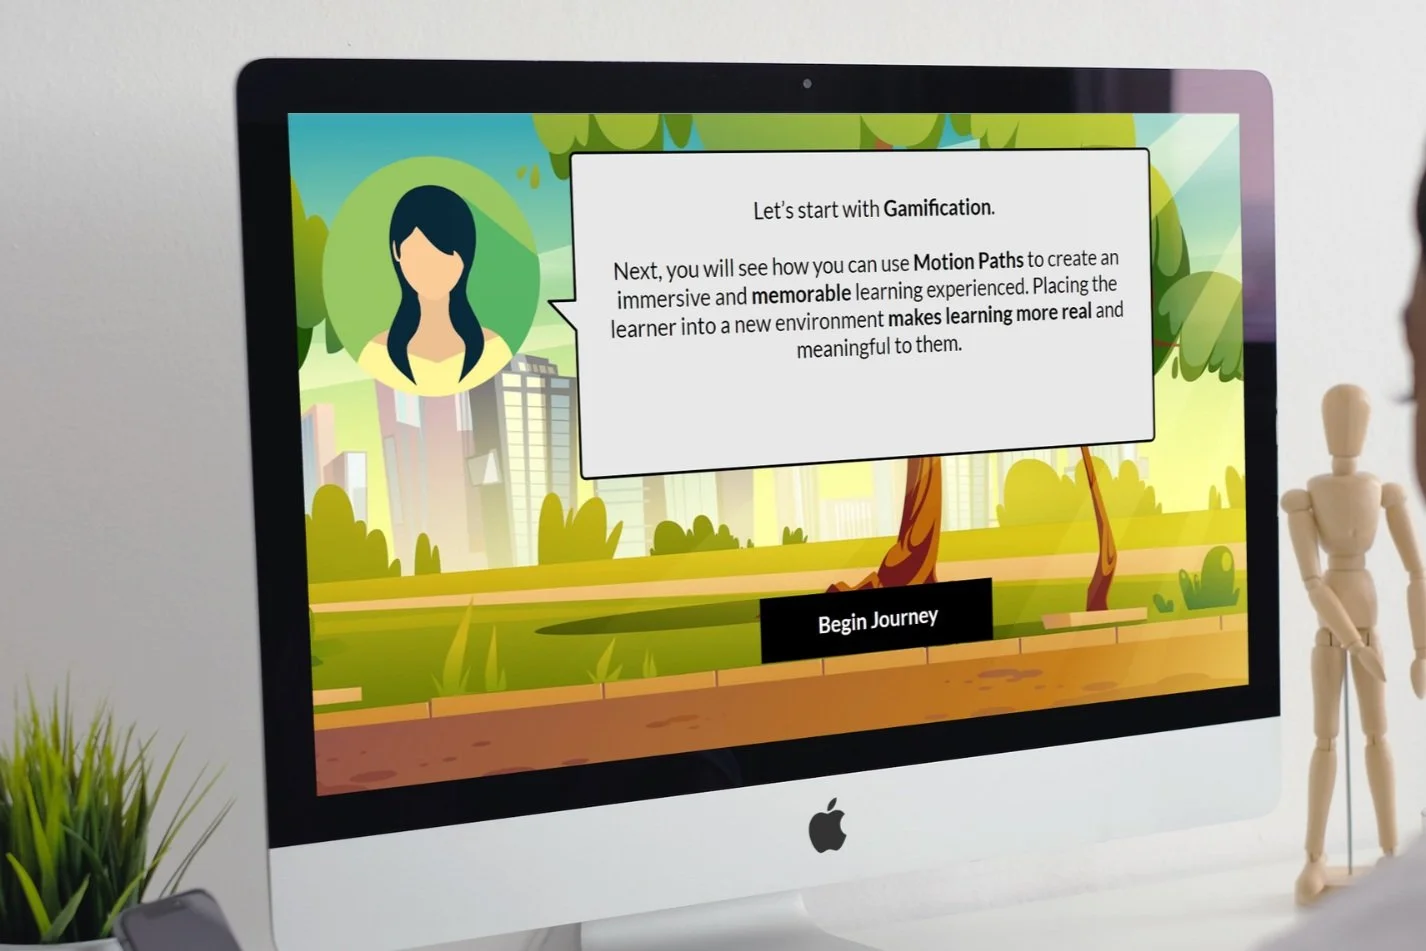
So instead of simply refreshing what was already there, I proposed a blended learning approach that combined updated in-person sessions with an interactive eLearning course. I designed a hands-on experience where learners could interact with graphs in meaningful ways, using terms and tools they’d use on the job.
Problem and Solution
Process
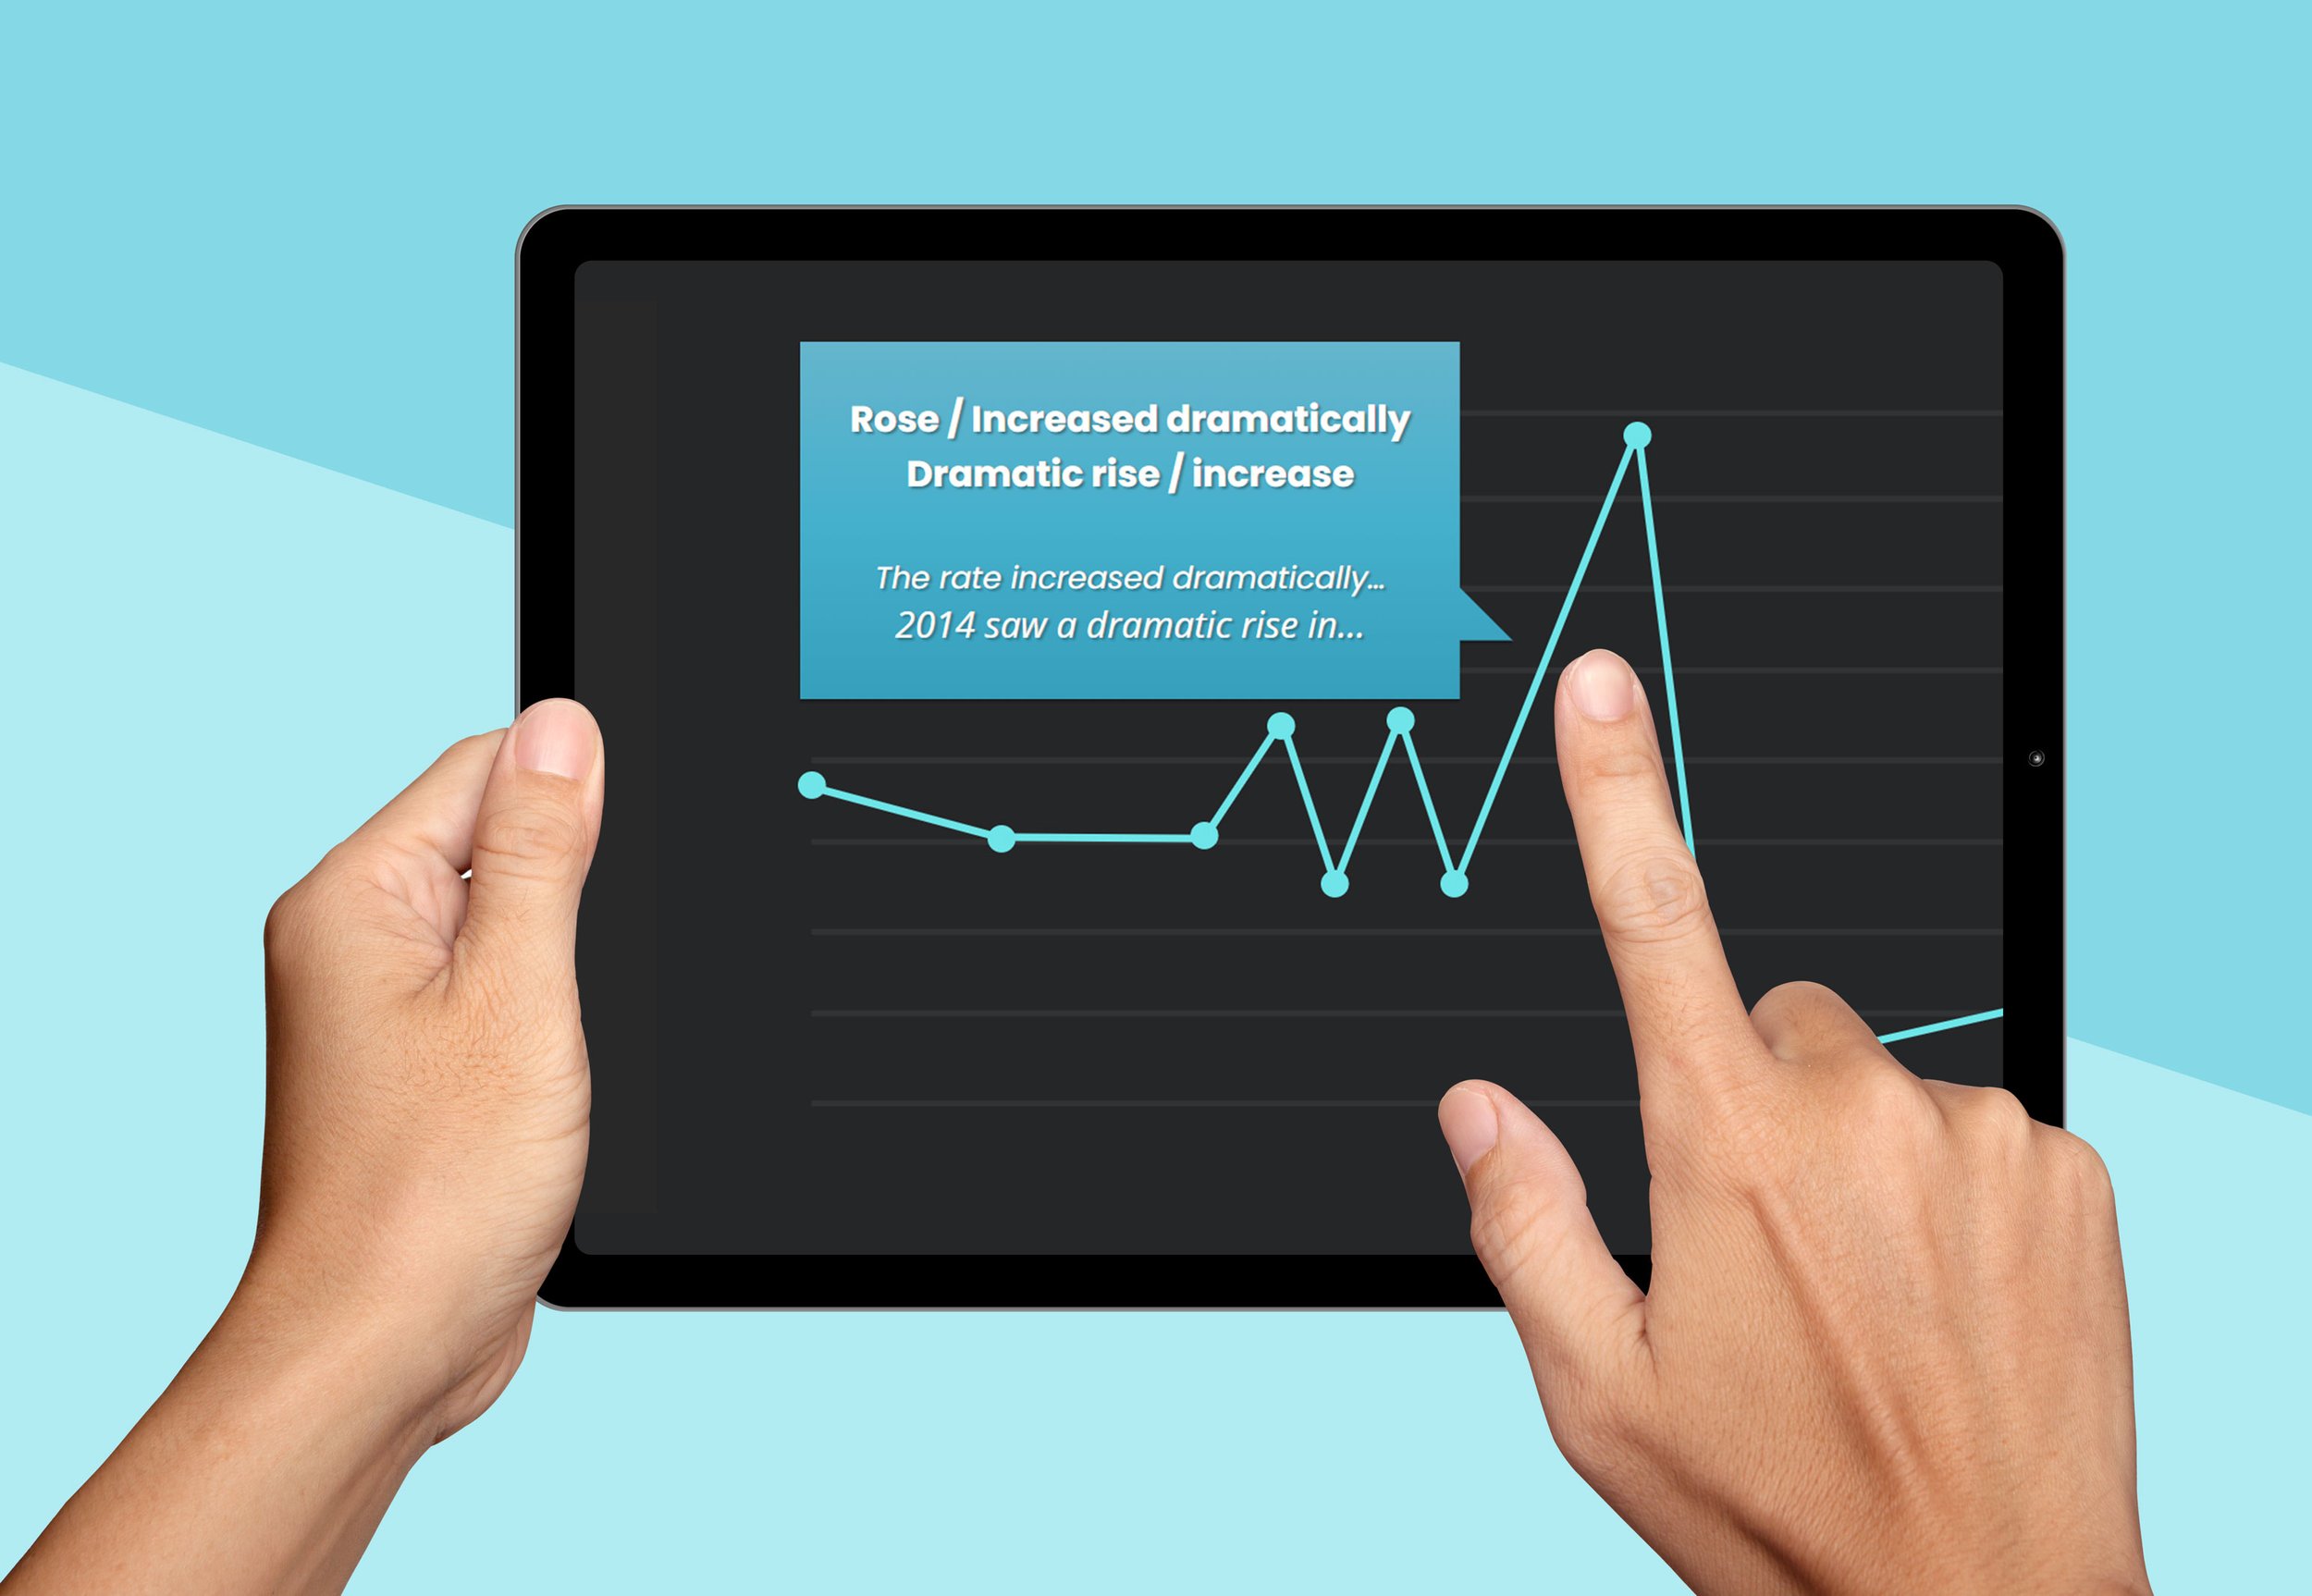
In the first section of the course, I introduced key vocabulary and grammar structures for describing graphs. Rather than simply clicking through content, learners brought their own understanding to the discussion. The course encouraged participation, prompting learners to analyze charts out loud, test phrases, and explore real examples.
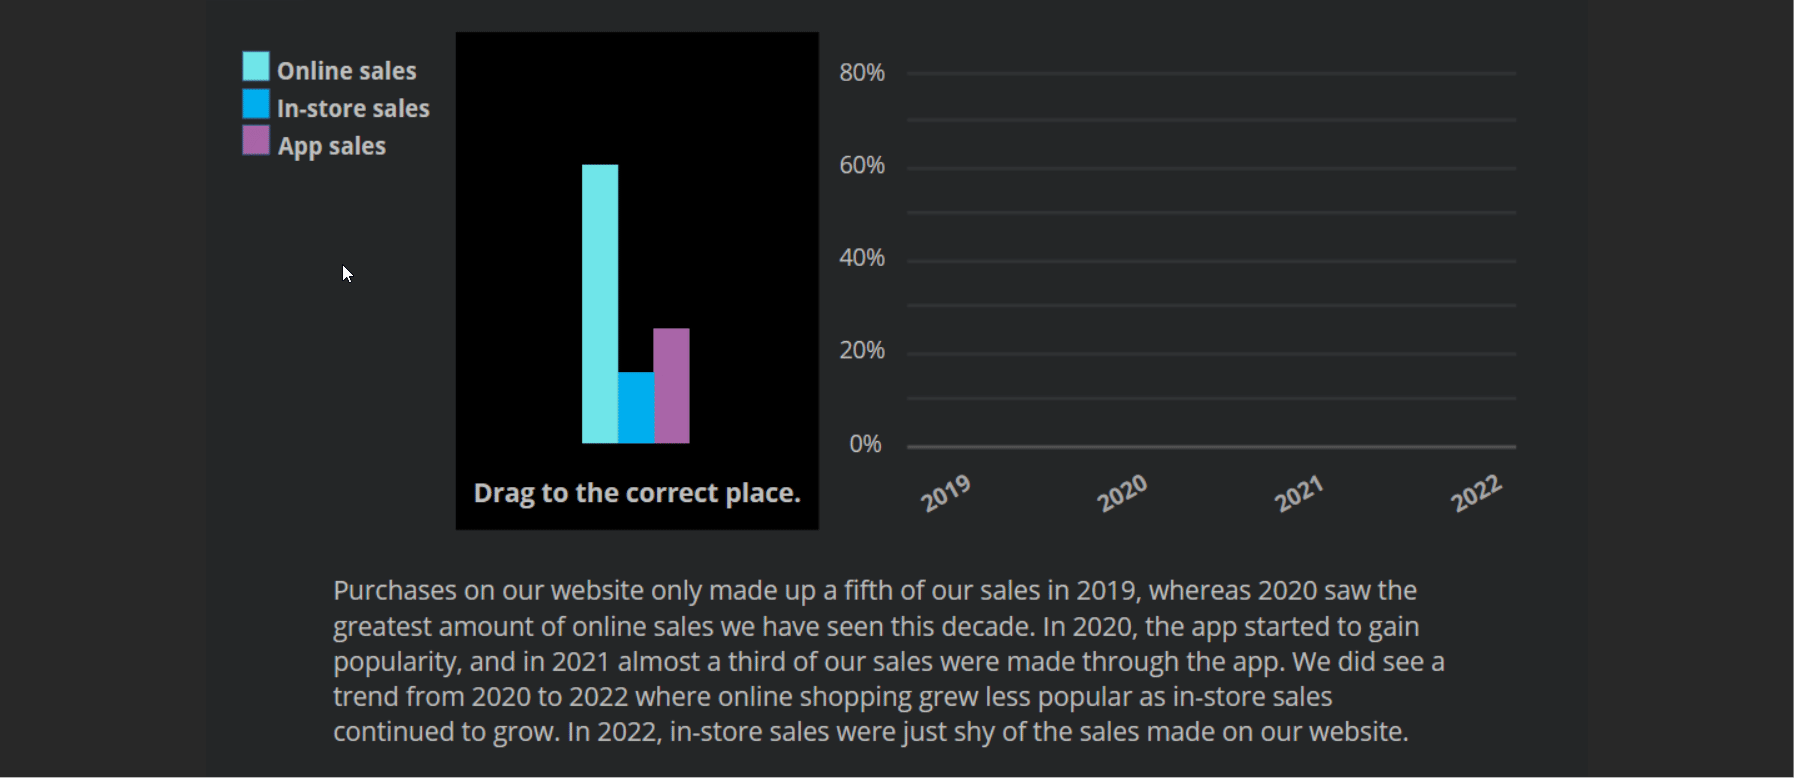
We took things further by letting learners build confidence through guided practice. They explored visual elements like trend lines, key phrases, and callouts—all within Storyline. Then they used drag-and-drop activities to apply what they’d learned, including identifying correct elements and choosing the most effective phrasing.
Culinary Art eLearning Training for Newly Hired Cooks

An onboarding course that combines clear instructions and strong visuals to help new hires quickly understand kitchen procedures.

To support retention, I created printed job aids with common phrases learners could reference during meetings. These simple tools helped bridge the gap between the training and the real world. Combined with the hands-on experience of the course, learners quickly became more confident and fluent in using data to support their communication.
Takeaways
The success of this training led to it being shared with other teams across the company.
One of the most exciting outcomes was seeing how quickly learners picked up the skills. Many had previously avoided using data in presentations—but after the course, they were eager to test out their new skills and proud of what they’d learned. Several shared that it was the first time they truly felt confident explaining a chart or using data effectively.
This project reminded me why I love this work: turning something intimidating into something empowering. I enjoy the challenge of taking complex ideas and making them easy to understand and apply. I look forward to more projects like this—ones that help learners build clarity and confidence through great design.
You may also like…

Diversity and Cultural Sensitivity Training
This course was developed for a multicultural workplace to support inclusive, respectful communication across diverse teams.
Gamified Instructional Designer eLearning Experience
This hands-on, gamified onboarding experience helps new instructional designers build confidence using real tools and branching scenarios.
The client had asked for updates to existing training materials and support with facilitating workshops. But before jumping into design, I reviewed the content and conducted a learner needs analysis. That revealed the real issue: learners weren’t just disengaged—they were struggling to communicate what different graphs were showing.
The existing approach relied heavily on in-person explanations that often skipped foundational skills. Learners lacked confidence and were unsure how to describe or use data in everyday work.
So instead of simply refreshing what was already there, I proposed a blended learning approach that combined updated in-person sessions with an interactive eLearning course. I designed a hands-on experience where learners could interact with graphs in meaningful ways, using terms and tools they’d use on the job.
Problem and Solution
Process
In the first section of the course, I introduced key vocabulary and grammar structures for describing graphs. Rather than simply clicking through content, learners brought their own understanding to the discussion. The course encouraged participation, prompting learners to analyze charts out loud, test phrases, and explore real examples.
We took things further by letting learners build confidence through guided practice. They explored visual elements like trend lines, key phrases, and callouts—all within Storyline. Then they used drag-and-drop activities to apply what they’d learned, including identifying correct elements and choosing the most effective phrasing.
To support retention, I created printed job aids with common phrases learners could reference during meetings. These simple tools helped bridge the gap between the training and the real world. Combined with the hands-on experience of the course, learners quickly became more confident and fluent in using data to support their communication.
Takeaways
The success of this training led to it being shared with other teams across the company.
One of the most exciting outcomes was seeing how quickly learners picked up the skills. Many had previously avoided using data in presentations—but after the course, they were eager to test out their new skills and proud of what they’d learned. Several shared that it was the first time they truly felt confident explaining a chart or using data effectively.
This project reminded me why I love this work: turning something intimidating into something empowering. I enjoy the challenge of taking complex ideas and making them easy to understand and apply. I look forward to more projects like this—ones that help learners build clarity and confidence through great design.
You may also like…
Diversity and Cultural Sensitivity Training
This course was developed for a multicultural workplace to support inclusive, respectful communication across diverse teams.
Culinary Art eLearning Training for Newly Hired Cooks
This hands-on, gamified onboarding experience helps new instructional designers build confidence using real tools and branching scenarios.
Gamified Instructional Designer eLearning Experience
An onboarding course that combines clear instructions and strong visuals to help new hires quickly understand kitchen procedures.